
Great events feel effortless to navigate
Event Flow Optimization for Conferences

Content
Picture this: 800 attendees funnel through a single registration desk while your keynote speaker waits backstage. The lunch line snakes around two corners, blocking access to breakout rooms. By 2 PM, half your audience has missed sessions they registered for—not because they weren't interested, but because they couldn't physically get there in time.
Poor planning creates friction. Smart event flow optimization removes it.
What Is Event Flow Optimization and Why It Matters for Event Success
Event flow optimization is the strategic design and management of how attendees move through physical or digital event spaces, when they engage with content, and how smoothly they transition between activities. It combines spatial planning, timing strategies, and behavioral prediction to eliminate bottlenecks and create seamless experiences.
The ROI impact is measurable. Events with optimized flow see 23-31% higher satisfaction scores compared to those with significant bottlenecks, according to data from professional event management associations. When attendees spend less time waiting and more time engaging, sponsors get better visibility, speakers reach fuller rooms, and organizers see improved post-event survey results.
Experience optimization directly affects your bottom line. A corporate conference that reduces registration wait times from 15 minutes to 3 minutes doesn't just make attendees happier—it adds 12 minutes of productive networking or content consumption per person. Multiply that across 500 attendees and you've recovered 100 hours of collective engagement time.
Consider the business outcomes: higher session attendance rates (typically 15-20% improvement), increased sponsor booth traffic, better food service efficiency (reducing catering waste by 10-18%), and stronger likelihood of repeat attendance. One event production company tracked their changes over three years and found that venues with optimized flow patterns generated 27% more positive social media mentions during events.
The stakes are higher than inconvenience. Poorly managed crowd flow creates safety risks, especially during emergencies. Fire marshals and venue managers increasingly require detailed flow plans before approving event permits.
Common Bottlenecks That Disrupt Attendee Movement at Events
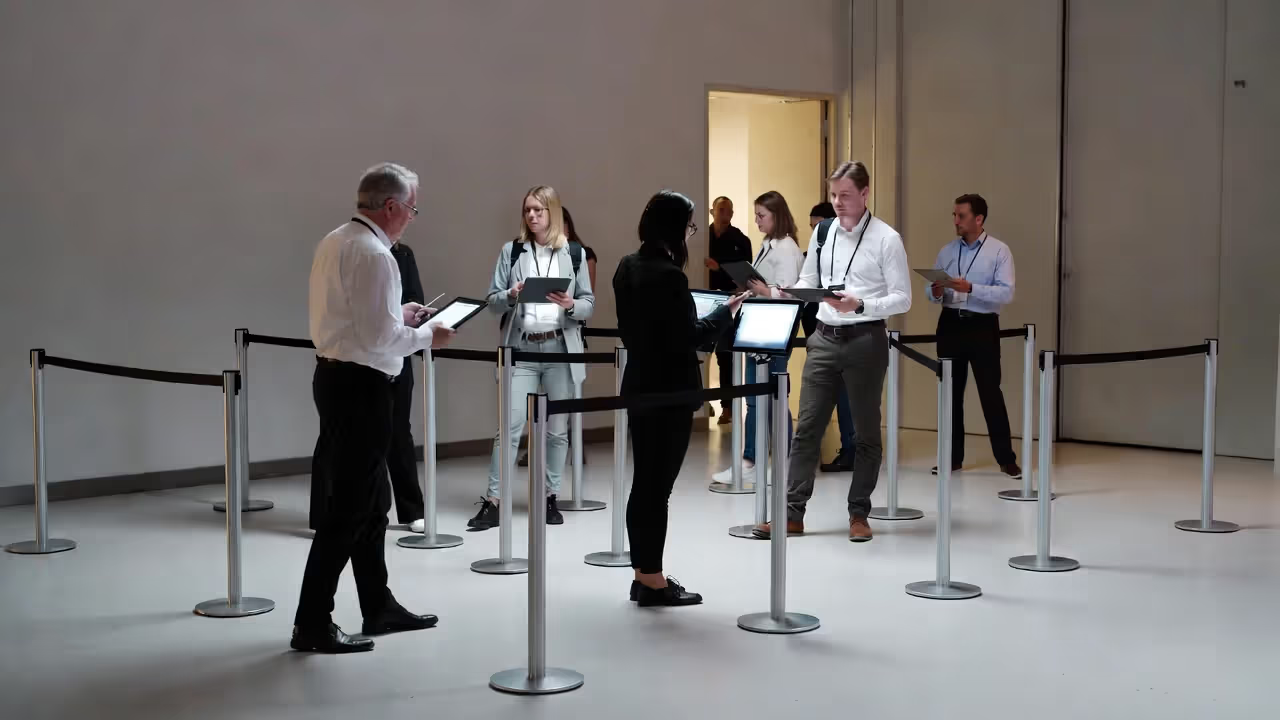
Registration delays remain the most common friction point. A single-lane check-in process for a 400-person event requires roughly 5-7 hours to process everyone if each registration takes 45-60 seconds. Yet most events allocate only a 90-minute window, creating immediate congestion.
Restroom queues spike during breaks. The International Plumbing Code recommends one toilet per 75 women and one per 150 men for assembly spaces, but many venues barely meet minimum requirements. A 20-minute break between sessions becomes effectively 12 minutes when attendees spend 8 minutes waiting.
Food service congestion follows predictable patterns. Buffet lines move at approximately 6-8 people per minute under ideal conditions. A 600-person lunch with two buffet stations requires 37-50 minutes minimum—yet planners often schedule 45-minute lunch blocks, forcing attendees to choose between eating and networking.
Author: Sophie Bennett;
Source: isnvenice.com
Session transitions create hallway gridlock when multiple rooms empty simultaneously. A conference with six concurrent breakout rooms releasing 100 people each floods corridors with 600 people within 3 minutes. Without adequate circulation space (minimum 6 feet width for bidirectional traffic), movement slows to a crawl.
Exit flow issues compound at event conclusion. Everyone wants to leave simultaneously, retrieve coats, and call rideshares from the same lobby. Poor exit planning creates 20-30 minute delays that color final impressions.
How Venue Layout Affects Crowd Flow
Column placement matters more than most planners realize. Structural columns positioned in natural walking paths force attendees into awkward navigation patterns. A ballroom with columns every 20 feet down the center creates two distinct traffic flows instead of one unified space.
Doorway width determines maximum throughput. A standard 36-inch door allows roughly 60 people per minute in single-file emergency conditions, but only 15-20 people per minute during normal movement when attendees pause to check phones or chat. Double doors don't double capacity—they typically increase throughput by only 60-70% due to the center divider.
Sightline obstructions slow movement because people hesitate when they can't see their destination. Curved hallways, abrupt turns, and opaque barriers force attendees to slow down and navigate cautiously, reducing average walking speed from 4.5 feet per second to 2-3 feet per second.
Elevation changes create unexpected bottlenecks. A venue with three steps between the registration area and main hall becomes a chokepoint as people slow down, watch their footing, and navigate while carrying bags or coffee.
Most event planners focus on content and aesthetics, but attendee movement patterns determine whether people actually experience what you've created. We've seen events with incredible speakers fail because people couldn't navigate the venue efficiently.
— Marcus Chen, Director of Event Operations at Summit Strategies Group
Technology Failures That Create Movement Problems
WiFi overload brings everything to a halt. When 400 people simultaneously try to access event apps, check email, or post photos, inadequate bandwidth creates frustration. Attendees cluster near known connection points, creating artificial congestion in areas that should have smooth flow.
Digital signage that freezes or displays outdated information sends people to wrong locations. One technology conference lost 90 minutes of productive time when their wayfinding system directed attendees to a keynote room that had been changed, forcing mass redirection.
Mobile app crashes during peak usage prevent attendees from accessing schedules, maps, or session updates. If your primary navigation tool fails, people revert to asking staff or wandering, both of which slow overall movement.
Badge printing systems that jam during registration create cascading delays. A malfunctioning printer processing 2 badges per minute instead of 10 turns a manageable queue into a 45-minute wait.
Proven Strategies to Optimize Crowd Flow at Events
Author: Sophie Bennett;
Source: isnvenice.com
Pre-event planning starts with calculating your load. Use the formula: (Expected Attendees × Average Dwell Time) ÷ Available Space. If 600 people will spend an average of 8 minutes in your registration area, you need space that can comfortably hold 80 people simultaneously (600 × 8 ÷ 60 = 80).
Implement staggered arrival times by assigning registration windows: "VIP registrants: 7:30-8:00 AM, Last names A-L: 8:00-8:30 AM, Last names M-Z: 8:30-9:00 AM." This simple strategy reduces peak load by 40-60%.
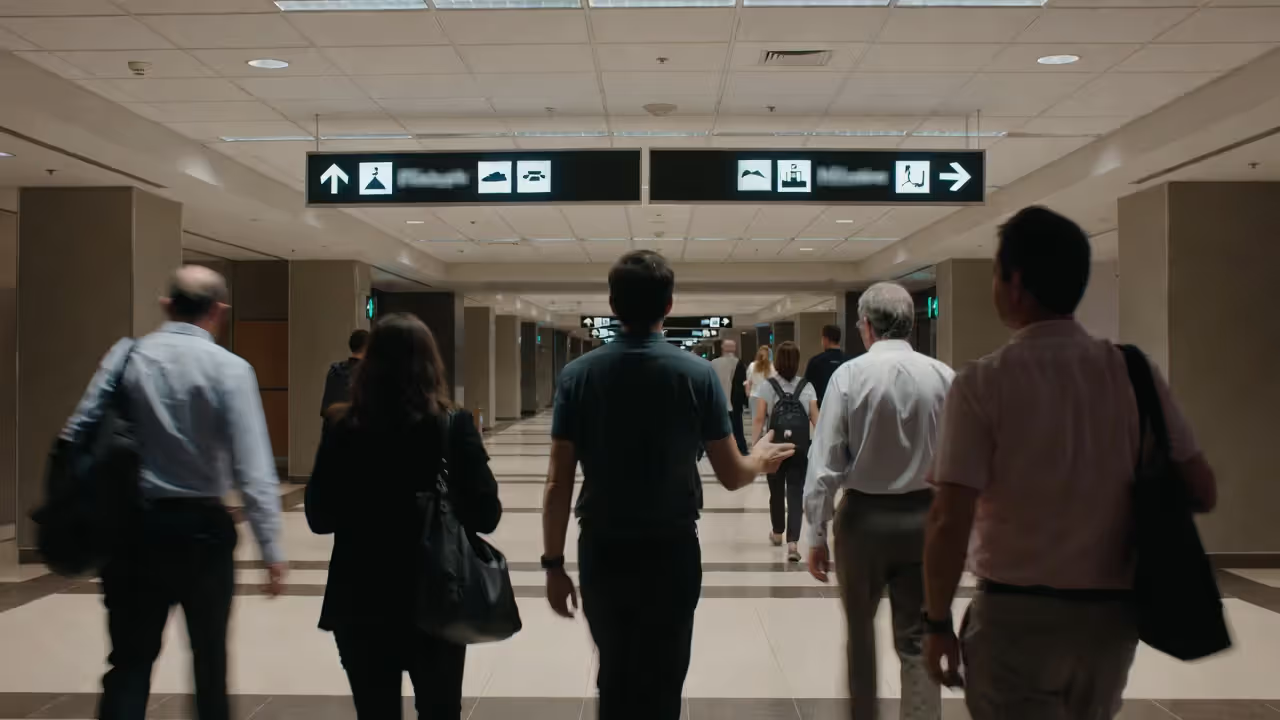
Signage systems should follow the "three glance" rule: attendees should be able to confirm their location and next destination within three visual references. Place directional signs at decision points—hallway intersections, elevator banks, and room entrances—not randomly along walls.
Staff positioning matters more than staff quantity. Two people stationed at corridor intersections directing traffic accomplish more than four people clustered at a help desk. Position staff where attendees make decisions, not where they ask questions after getting lost.
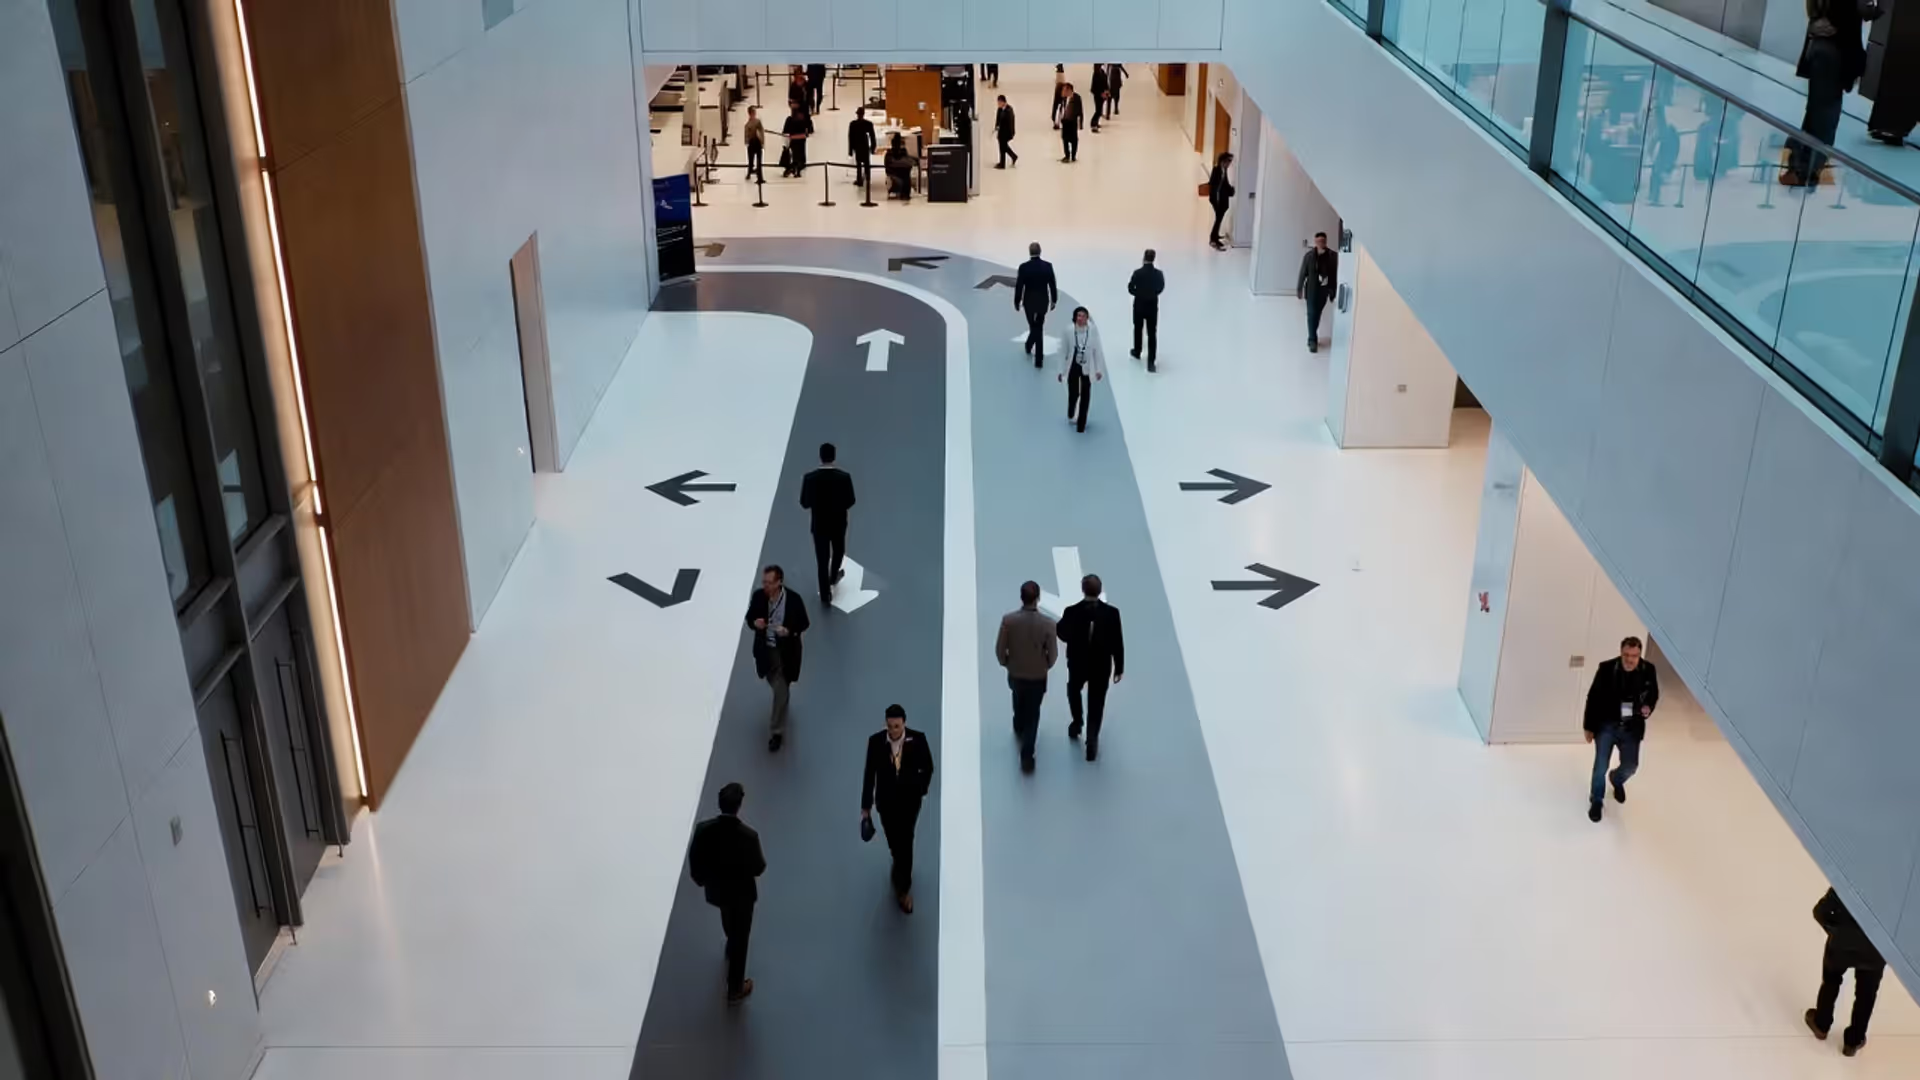
Traffic pattern design should create one-way flows whenever possible. At food stations, establish clear entry and exit points. A circular traffic pattern around a buffet moves 30-40% more people than a linear back-and-forth approach.
Using Data and Heatmaps to Predict Movement Patterns
RFID badge tracking reveals actual movement versus planned movement. One corporate event discovered that only 12% of attendees used their carefully designed "networking corridor," while 67% clustered in an unplanned area near the coffee station. They relocated sponsor booths accordingly.
Historical data from similar events provides baseline expectations. If past conferences show that 40% of attendees skip lunch sessions to make phone calls, plan for lighter afternoon session loads and designate quiet calling areas to prevent hallway congestion.
Author: Sophie Bennett;
Source: isnvenice.com
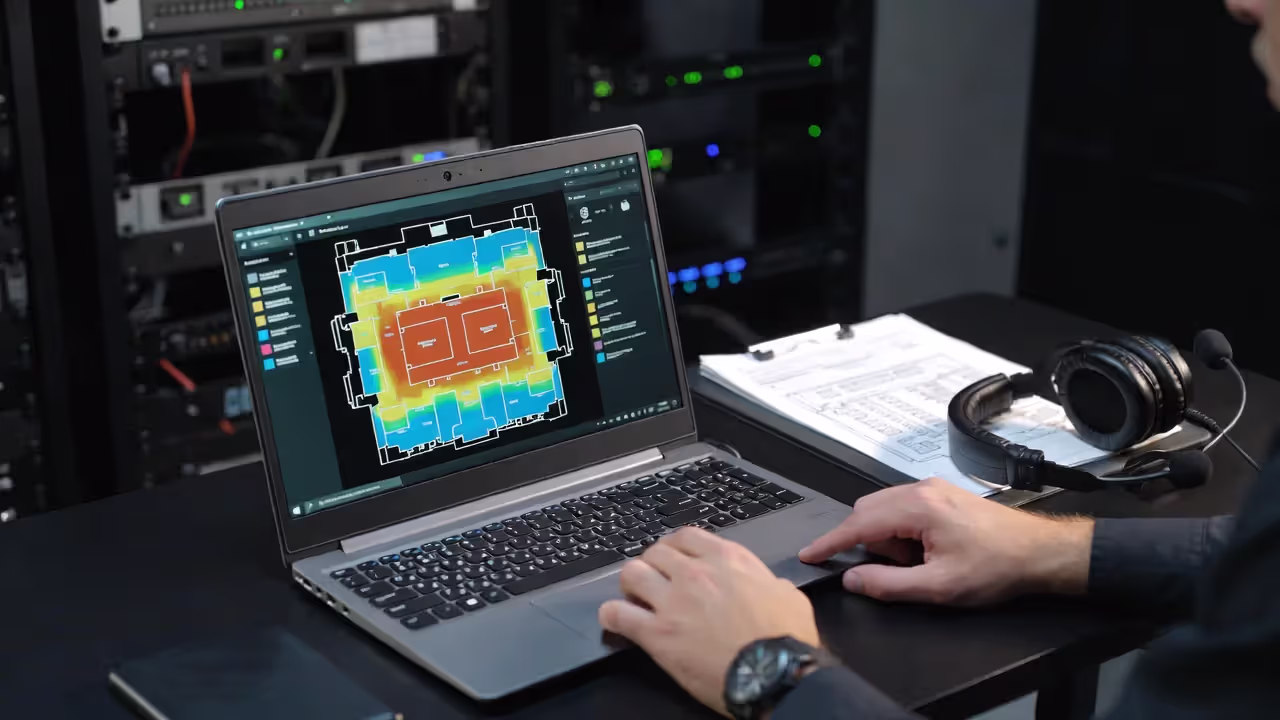
WiFi analytics show concentration patterns without requiring special hardware. Your venue's existing WiFi infrastructure can generate heatmaps showing where people spend time. These patterns often contradict assumptions—one trade show found their "prime" booth locations had 30% less foot traffic than mid-aisle positions near restrooms.
Post-event surveys should ask specific movement questions: "Did you experience any delays accessing sessions?" and "How would you rate navigation ease?" rather than generic satisfaction questions. Quantifiable feedback drives better optimization.
Zone-Based Design for Different Event Types
Corporate conferences benefit from hub-and-spoke layouts. Create a central gathering space with breakout rooms radiating outward. This design ensures attendees always return to a common area, facilitating spontaneous networking and reducing the "lost in hallways" phenomenon.
Trade shows require perimeter anchor placement. Position major exhibitors or attractions at corners and far ends to pull traffic through the entire space. If all premium booths cluster near the entrance, back sections become dead zones.
Networking events need conversation zones with defined purposes. Designate high-top table areas for standing conversations, lounge seating for longer discussions, and open spaces for circulation. Without zoning, everyone clusters near the bar, leaving 60% of your space underutilized.
Multi-day conferences should rotate high-traffic elements. If registration is in the east wing on Day 1, move coffee service there on Day 2 to distribute wear patterns and encourage exploration of different venue areas.
Interaction Timing: Scheduling Activities to Maximize Engagement
Session length optimization follows attention span research. The ideal presentation length is 18-22 minutes for maximum retention, but practical event scheduling usually requires 45-50 minute blocks. Compromise by building in 5-minute transitions and encouraging speakers to include interactive elements every 15 minutes.

Author: Sophie Bennett;
Source: isnvenice.com
Break timing should account for actual needs, not arbitrary schedules. A 10-minute break between sessions is insufficient when attendees need to walk 3 minutes to the next room, use restrooms, and check messages. Build 15-20 minute buffers for room changes, 12-15 minutes for same-room transitions.
Networking windows work best when scheduled, not left to chance. A structured 30-minute networking session with prompts ("Find someone from a different industry") generates more connections than a vague "networking hour" where people check email.
Transition buffers prevent schedule collapse. If your first morning session runs 10 minutes long, that delay compounds through the day unless you've built 5-minute cushions between activities. A conference with eight sessions needs at least 40 minutes of buffer time distributed throughout the day.
Engagement pacing requires rhythm variation. Alternate between high-energy general sessions and smaller breakout discussions. A schedule with three consecutive 90-minute lectures creates fatigue; breaking them up with 30-minute interactive workshops maintains energy.
Avoid the "post-lunch death slot." The 1:00-2:30 PM window shows the lowest engagement and highest no-show rates. Schedule less critical content then, or use that time for hands-on workshops that require physical activity to combat afternoon drowsiness.
Technology Tools for Managing Experience Optimization
Event apps centralize information but only work if attendees actually download them. Incentivize adoption with exclusive content, gamification, or prize drawings. An app with 30% adoption provides some value; 70%+ adoption becomes a genuine flow management tool.
RFID tracking systems monitor real-time attendance and movement. Badges with embedded chips trigger sensors at doorways, providing instant data on session popularity, dwell times, and traffic patterns. This technology costs $3-8 per badge but generates actionable insights.
Real-time monitoring systems display live occupancy data. Digital dashboards show staff when rooms approach capacity, allowing them to redirect attendees before bottlenecks form. Some systems integrate with mobile apps to notify attendees: "Session A is at 95% capacity. Consider Session B as an alternative."
Author: Sophie Bennett;
Source: isnvenice.com
Predictive analytics platforms use historical data and machine learning to forecast congestion points. These tools analyze factors like session topics, speaker popularity, and time of day to predict which areas will experience heavy traffic, allowing proactive staffing adjustments.
| Platform | Key Features | Pricing Tier | Best For | Integration Capabilities | Mobile App |
| EventFlow Pro | RFID tracking, real-time heatmaps, predictive analytics | $2,500-$8,000 per event | Large conferences (500+ attendees) | Salesforce, HubSpot, Zoom | iOS, Android |
| CrowdCompass | Attendee app, wayfinding, session tracking | $2,000-$6,000 per event | Multi-session events | Cvent, Marketo, custom APIs | iOS, Android, web |
| Pathable | Virtual/hybrid support, networking tools, live polling | $3,000-$10,000 per event | Hybrid events | Microsoft Teams, Slack, Zapier | iOS, Android, web |
| Eventbase | Custom branded apps, beacon technology, offline access | $4,000-$12,000 per event | Corporate events, trade shows | Most major CRM/marketing platforms | iOS, Android |
| Whova | Agenda management, attendee networking, live Q&A | $1,000-$4,000 per event | Small to mid-size events (50-1,000) | Eventbrite, RegFox, PayPal | iOS, Android |
| SpotMe | Enterprise-grade security, advanced analytics, content library | $8,000-$25,000 per event | Large corporate events, pharma conferences | Salesforce, Marketo, custom integrations | iOS, Android, web |
Queue management software reduces perceived wait times. Digital systems that provide estimated wait times and allow virtual queuing let attendees grab coffee instead of standing in line, improving satisfaction even when actual processing times remain unchanged.
Measuring Success: KPIs for Engagement Pacing and Flow Efficiency
Dwell time metrics reveal whether spaces serve their intended purpose. If your networking lounge shows an average dwell time of 4 minutes, it's functioning as a hallway, not a gathering space. Target dwell times: networking areas (15-25 minutes), expo booths (5-8 minutes), food service (8-12 minutes).
Session attendance rates indicate whether your schedule works. Consistent 85%+ attendance suggests good timing and flow. Rates below 70% signal problems—either session content doesn't match expectations, or attendees can't physically access rooms efficiently.
Net Promoter Scores (NPS) should be tracked specifically for logistics. Ask: "How likely are you to recommend this event based on ease of navigation and schedule management?" separately from content quality. This isolates flow issues from programming concerns.
Movement speed data identifies bottlenecks. Track average walking time between key points: registration to main hall, breakout rooms to lunch area, session rooms to exits. Compare actual times against theoretical minimum walking times. If the theoretical minimum is 2 minutes but average actual time is 7 minutes, you've found congestion.
Session turnover rates measure transition efficiency. Calculate: (Number of attendees who attended consecutive sessions in different rooms) ÷ (Total attendees who attended multiple sessions). Rates below 60% suggest insufficient transition time or poor wayfinding.
Food service efficiency tracks waste and satisfaction simultaneously. Measure: (Total food consumed) ÷ (Total food prepared) and (Number of attendees who completed lunch) ÷ (Total registered attendees). High waste with low completion rates indicates flow problems, not appetite issues.
FAQ: Event Flow Optimization
Building Better Event Experiences Through Strategic Flow
Event flow optimization isn't about controlling attendees—it's about removing obstacles that prevent them from getting value from your event. Every minute spent waiting in line or searching for a room is a minute not spent learning, networking, or engaging with sponsors.
Start with the basics: adequate signage, strategic staff placement, and realistic scheduling. Track what actually happens at your events, not what you hoped would happen. Use that data to refine your approach for the next event.
The best event flow is invisible. Attendees shouldn't consciously notice your optimization efforts—they should simply find themselves in the right place at the right time, ready to engage. When people leave your event energized rather than exhausted, talking about content rather than logistics, you've succeeded.
Small improvements compound. Reducing registration time by 5 minutes, adding one extra restroom station, or building 10-minute buffers between sessions might seem minor individually. Together, they transform attendee experience and deliver measurable business results.
Your next event doesn't need perfection—it needs thoughtful planning, honest measurement, and continuous improvement. Start optimizing one element at a time, and you'll build momentum toward genuinely seamless events.